What can train travel queries learn us for crowd forecasting?
Train journey intentions (iRail logs): ten days of queries
This figure illustrates that most of the trips are from/to Brussels, even if a non-negligible part of the trips occur between neighboring cities (unless there is no railroad between them). Based on search data from 20 Dec 2015 to 31 Dec 2015. A line segment links the origin and the destination of the journey. Graph made using QGIS connected to a PostgreSQL database. Base layer: © Mapbox & OpenStreetMap contributors.
Most wanted destinations in Belgium:
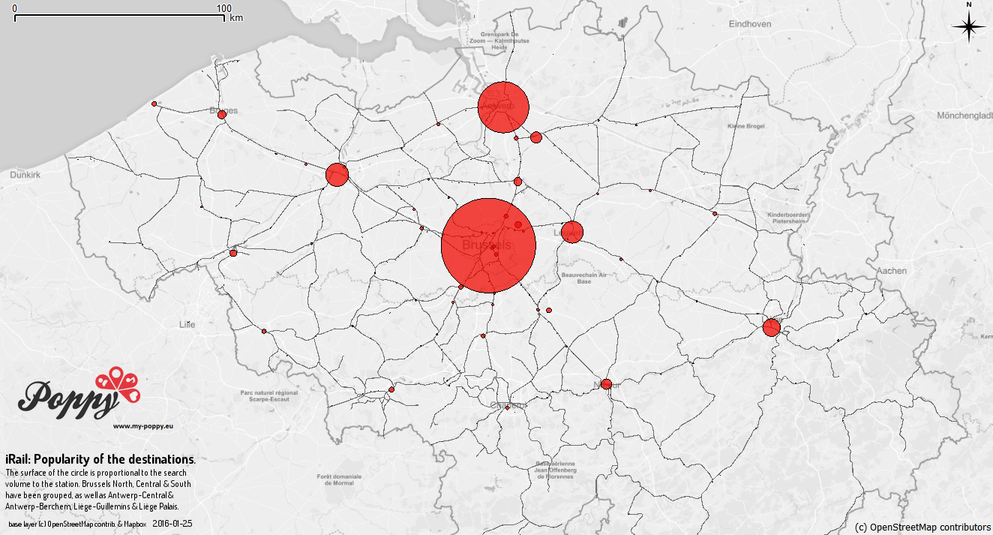
This figure illustrates that most of the trips are from/to Brussels. The stations of the main cities have been grouped (Brussels-North, Central & South,
Antwerp-Central, Berchem & South, Liège Guillemins & Palais, Charleroi-South & West. Based on search data from 20 Dec 2015 to 20 Jan 2016. Graph made using QGIS connected to a PostgreSQL database. Base layer: © Mapbox & OpenStreetMap contributors. We are grateful to Pr. Isabelle Thomas (Université Catholique de Louvain, Belgium) for her kind methodological advices. The errors that may remain are our own.
Do iRail queries help to monitor the crowd for large events?
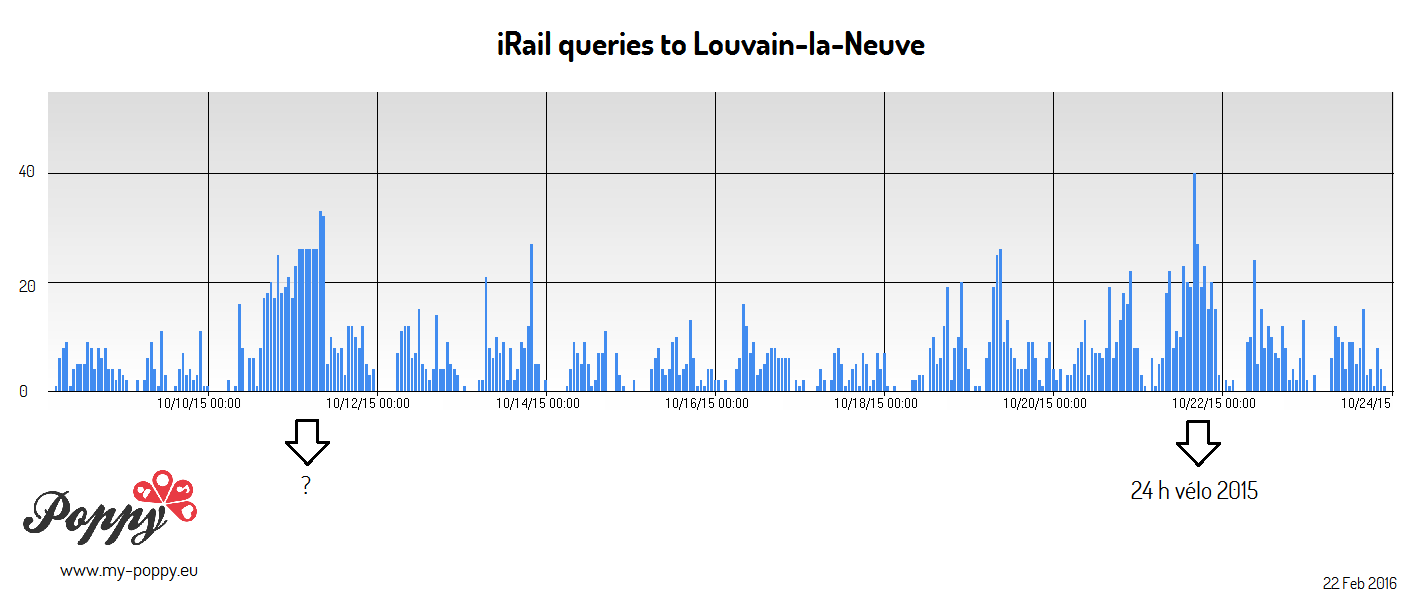
This figure illustrates the hourly volume of queries for the station “Louvain-la-Neuve Université” as destination. The 20th and 21th of October, 2015 stand out of the noise. These are the dates of the 24 heures vélo, the largest student gathering of the year in Louvain-la-Neuve (~ 45,000 PAX). What happened in Louvain-la-Neuve on 10-11th of October, 2015 is however unclear to me. Do you know more? Join the conversation on Twitter using using #poppy #irail!
iRail lets you download GTFS data for the whole public transit system in Belgium. In 2015, @pietercolpart released the search logs of iRails as open data. You can read them from api.irail.be/logs. For the maps shown here, we used the stations of origin, destination and the time of the query.